Engagement benchmarks are data points that indicate how well your social media content is performing. Measuring engagement helps you create a credible competitor analysis and is the best indicator for measuring the accuracy of your targeting. You won’t know where you stand in the marketplace without tracking your engagement benchmarks.
Analyzing your engagement benchmarks provides you with invaluable insights into your messaging strategy. First, you’ll know if your content is reaching and resonating with your target audience. Secondly, you’ll know if your content strategy is working and what, if anything, you need to improve. Finally, if you see that performance is not measuring up to your campaign goals, you’ll be able to pivot quickly, make the necessary optimizations, and continue without losing precious resources.
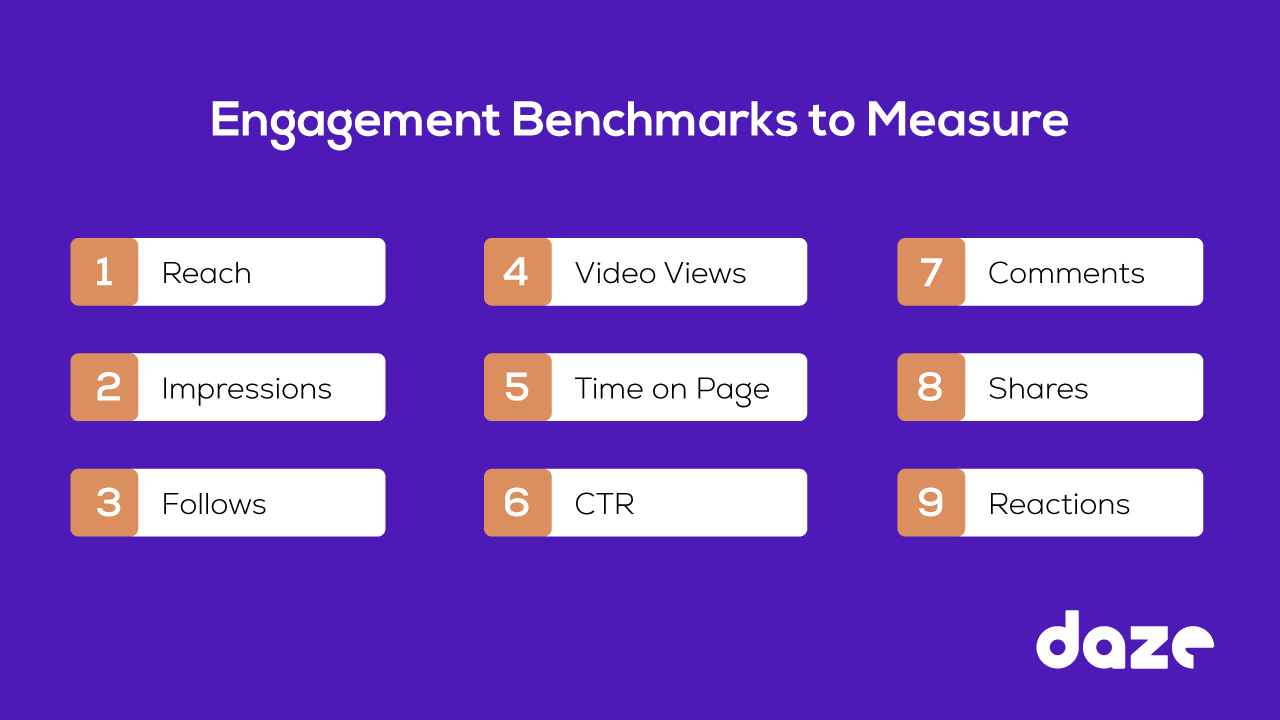
The metrics you measure depend on your marketing goals and business objectives. However, at a minimum, you’ll want to track the following engagement benchmarks
- reach
- impressions
- follows
- video views
- time on page
- CTR
- comments
- shares
- reactions.
Continue reading to learn more about the importance of engagement benchmarks and how to use them to improve your content marketing performance.
Your Reach Benchmark
Reach is the number of people who have seen your content or ad within a set period. They may see your content or ad several times, but they’re only counted once.
Reach measures the validity of your targeting, content creation, and data reliability. Specifics to analyze are:
- What is your average reach?
- What is the reach of each piece of content you published?
- What is the percentage of followers vs. non-followers who opened your content? A high percentage of non-followers means your content is being shared.
Your reach benchmark also lets you know when you’re ready to move forward with BOF (bottom of the funnel) content.
Impressions Metrics
The number of times users were exposed to your content.
Your impressions metrics will be higher than your reach, but it doesn’t mean they are engaged with your content. For example, you run an ad on LinkedIn. It was displayed 500 times; therefore, your impressions would be 500. But if only 200 people saw it, it means that your reach is 200 and each person, on average, saw it 2.5 times. So, your reach (uniques) can be 200 while impressions can be more than that.
However, the more often potential customers see your content, the more familiar they become with your company’s products or services. In addition, repeated exposure leaves a memory that can be recalled when a B2B buying team begins to search for solutions to their problems.
Follower Count
Follower count is a more stable metric than post reach and reaction, which fluctuate depending on the channel’s algorithms. The number of followers indicates your influence, so you want steady growth.
It’s not unusual to lose followers, but a significant drop-off suggests your content is not engaging, or you need to rework your targeting. Likewise, if you see a substantial number of new followers, inspect the content you published during that time frame. Then, find ways to repeat the success.
You’ll also want to know where your followers come from to ensure that you’re connecting with an audience that advances your business goals.
Analyze the growth percentage of your followers compared to competitors. This will help you optimize your targeting and messaging.
Video Views And Video Completion
You want to follow two video metrics: video views and video completion rate.
If a B2B buyer begins to watch your video, even for a few seconds, it counts as a video view. You might learn from this metric that your video intro or the thumbnail you chose is engaging. But, the more important metric is how many people watch your video until the end. Therefore, you want a high-performing video completion rate. This tells you that you’ve created an informative, helpful, and engaging video that connects with your target audience.
LinkedIn’s average video view rate is %14.46, with smaller vendors experiencing greater success. (SocialInsider data)
Dwell Time (Time Spent On A Page)
The time spent on a page is another critical engagement benchmark to follow. A longer duration on your page indicates that readers found your content valuable and engaging.
The average person spends roughly 1.37 minutes skimming an article. (HubSpot data) If your metrics show a shorter dwell time, it usually means that your content is not valuable or engaging. However, it could mean that your content is reaching the wrong audience. You might need to tweak your targeting to ensure that your messaging reaches buyers who will be interested in your page’s content.
CTR (Click-Through Rate)
The CTR benchmark tells you the number of people who click the link in your post to access additional information. It is one of the most important quality measures.
For example, let’s say you create a LinkedIn post and include a link to your website or a link to access a white paper. Your goal is that your b2b target audience clicks on the link. If your CTR rate is high, then you’ll know that you’re offering value-laden content or that your post messaging was engaging enough to make the reader want to visit your website to learn more.
The average CTR on all types of LinkedIn content is 2.20%. Native documents performed better, averaging 3.5% to 8.6%, depending on business size. (SocialInsider data)
You’ll want to measure CTR engagement benchmarks for both paid and organic content.
Number Of Comments
A large number of comments under your digital media posts could be a good thing, depending on the nature of the comments. Typically, though, if your post receives many comments, it indicates that people are reading your content, that it resonates with them and they feel inspired to leave their thoughts. You’ll increase the number of contents if you leave a visible CTA.
Comments are one of the easiest ways to get customer feedback. Algorithms favor digital media posts and blog articles that receive comments. Focus on value and engagement, and you’ll be able to use comments as a tool to build visibility and customer loyalty.
Shares
Digital channels enable sharing differently. For instance, on LinkedIn, you “re-share, whereas on Facebook, you “share.” Twitter users “retweet.” A high number of shares indicates that your content is valuable and worthy of sharing with their network. A digital channel user might also share your profile, a form of digital word-of-mouth marketing, exposing new potential customers to your services or expertise.
Reactions Benchmark
LinkedIn recently added a laughing emoji. It’s received mixed reactions so far, but LinkedIn users seem to be excited about a new way to react to content. Each time a reader clicks on a reaction icon, such as like, celebrate, or curious, it’s measured as a reaction. A high level of reactions to your content indicates that your audience is paying attention to what you publish.
Engagement Benchmarks: How To Track
Tracking engagement benchmarks is critical to your bottom line. Understanding how your content performs enables you to assess if you’re spending money in the right places and how much you’re getting in return. In addition, by tracking engagement benchmarks, you’ll be able to prove the success of your digital marketing strategies and spot any trends that require a change in your approach.
As the brief overview above shows, measuring engagement benchmarks requires collecting big data. Further, each digital media platform collects and provides social metrics differently. You’ll likely have different stakeholder groups interested in analyzing the benchmarks according to their respective roles.
Every digital channel has built-in analytics, but an analytics tool is a preferred way to track engagement benchmarks. The most popular tools include Hootsuite, HubSpot, Sprout Social, BuzzSumo, SparkToro, and Google Analytics.
How Can You Improve Engagement?
Redefine your target audience. Revisit your buyer personas and be sure you’re publishing content that addresses their pain points.
Publish customer-centric, value-added content. If you’re not seeing the engagement metrics you want, re-evaluate your content creation strategy. Original, informative content that provides value to your target audience will increase your engagement metrics.
Adjust your posting times for maximum impact. Part of understanding your target audience is knowing the platforms they use and the optimal posting times on those platforms. A one-size-fits-all digital marketing approach doesn’t work. Instead, you might be able to improve your engagement metrics by selecting better posting times.
Increase USG content. User-generated content serves as social proof. In today’s ecosystem, where B2B buyers interact with digital content almost exclusively, content that proves the legitimacy of your products or services will differentiate you from the competition.
Create content experiences. The most effective way to improve your engagement metrics is to use rich visuals, images, and videos that your audience can relate to.
Engage with your audience. It can take time, but answering questions and responding to comments is an effective way to maintain and grow your audience. Communicating with your followers shows that you care about what they think. That conversation could attract others with the same question or problem, generating new leads.
Include visible, engaging CTAs. Posting content with a link isn’t enough. Your readers need a prompt to click on that link. You can’t over-use CTAs.
Mix up your content. If your digital content becomes redundant, you’ll lose followers and see a decline in other engagement metrics. Your audience may feel that they’ve already learned everything you have to offer. By mixing up your content, you won’t come off as repetitive and boring. Try different content types, such as videos, live videos, images, games, surveys, contests, etc.
Bottom Line
Measuring engagement benchmarks is not an option in today’s ecosystem, where virtually the entire sales cycle takes place on digital platforms.
Engagement benchmarks tell you if you’re reaching your target audience.
They provide essential information for your content marketing team to determine which content types or ad campaigns are working.
Once you understand how your content and ads are performing, you’ll be able to improve your content creation and publication throughout the buying funnel.